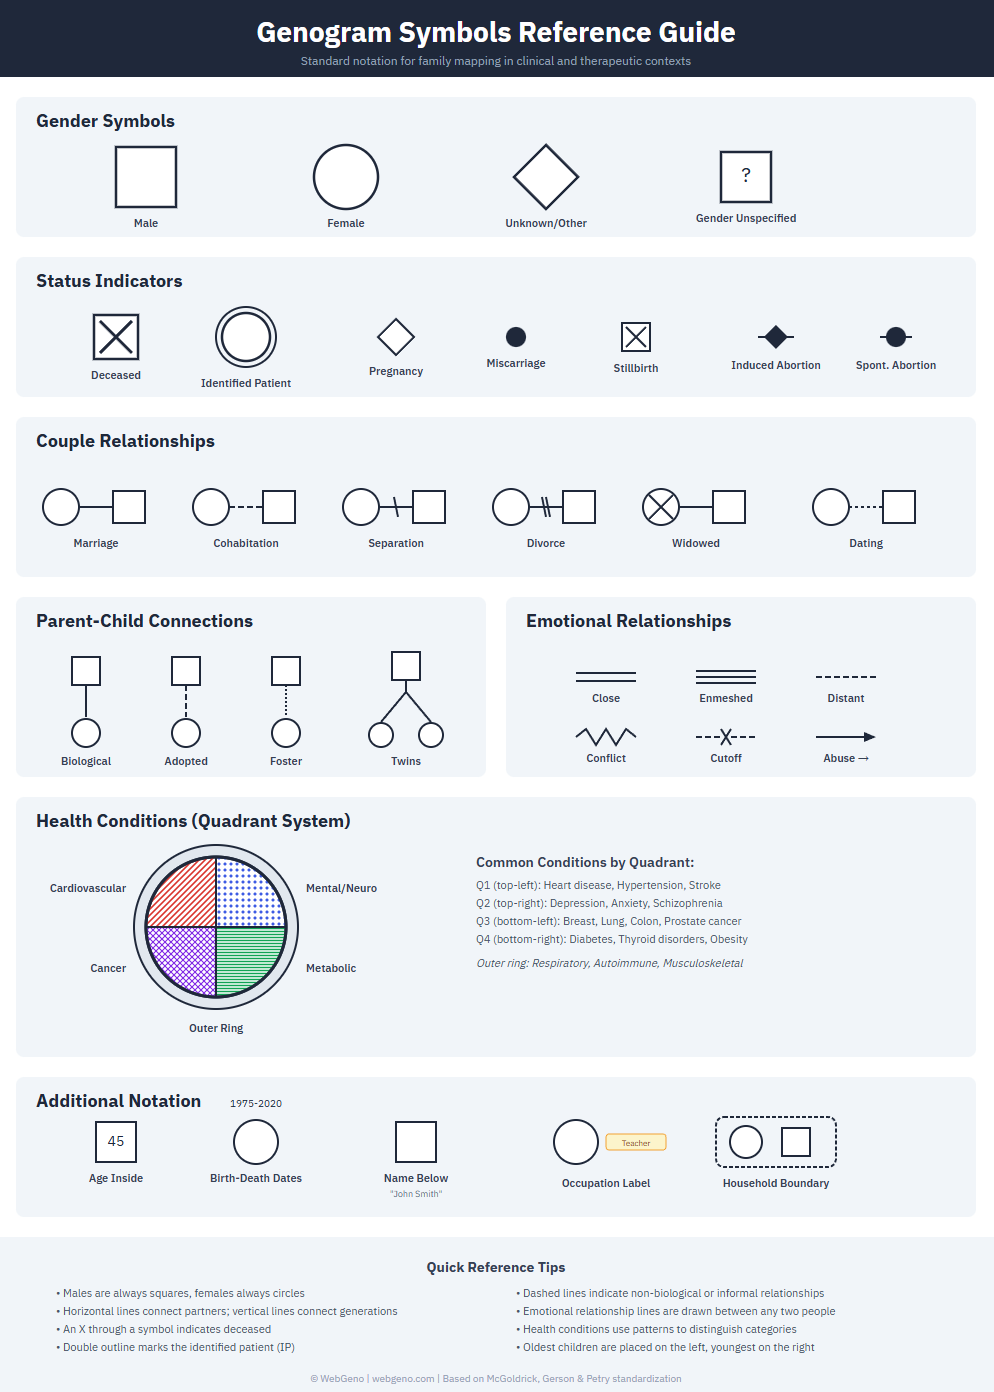
Genogram symbols are standardized notations used to visually represent family structure, relationships, and health patterns across generations. The family diagram was originated by Murray Bowen, and the standardized symbol set was developed by Monica McGoldrick and Randy Gerson (first published in 1985 and refined in later editions). They are commonly grouped into the following categories:
- Structural symbols — squares for men, circles for women, with markers for deceased, pregnancy, miscarriage and unknown sex
- Relationship lines — horizontal lines connecting partners (married, divorced, separated) and vertical lines connecting parents to children
- Emotional relationships — patterned lines showing closeness, conflict, distance, estrangement and fusion (the published standard is monochrome; color is a software convention)
- Health and social conditions — shading and patterns indicating medical, psychiatric or substance-use conditions
- Specialized symbols — adoptions, twins, IVF, foster care and cultural or spiritual indicators
- Annotations — birth and death dates, names, and clinically relevant life events
Looking for a quick reference? See our Genogram Symbols Reference Chart for a table-based overview of all symbols, or continue reading for in-depth explanations with clinical context.
📄 Download the free PDF Cheat Sheet — print-friendly, one page.
🧩 Want to use these symbols right away? Try our free genogram maker — every symbol is built in.
Genogram Symbol Quick Reference Table
| Symbol Type | Visual | Meaning | Usage |
|---|---|---|---|
| Male | Represents male family members | Basic structural symbol | |
| Female | Represents female family members | Basic structural symbol | |
| Unknown Sex | Sex not known or unspecified | Question mark in/beside the symbol (diamond = non-binary per McGoldrick 2020) | |
| Deceased Male | Deceased male family member | X drawn through gender symbol | |
| Deceased Female | Deceased female family member | X drawn through gender symbol | |
| Marriage | Married couple | Horizontal solid line between partners | |
| Divorce | Divorced couple | Two slashes through marriage line | |
| Close/Harmonious | Very close, harmonious relationship | Two parallel lines between people | |
| Conflict | Conflictual relationship | Zigzag/jagged line between people | |
| Cutoff | Estranged, no contact | Break/fence in the connection line | |
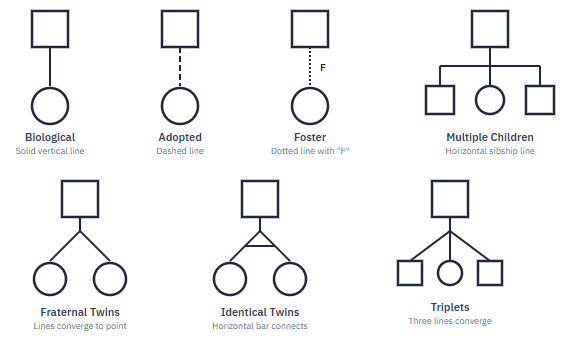
| Biological Child | Biological parent-child connection | Solid line from parents to child | |
| Adopted Child | Adopted parent-child relationship | Dashed line from parents to child | |
| Foster Child | Foster care relationship | Dotted line from parents to child | |
| Twins | Twin siblings | Lines converge to single point on family line | |
| Miscarriage | Pregnancy loss / spontaneous abortion | Small triangle with X | |
| Stillbirth | Baby died at birth | Gender symbol with X and "SB" label | |
| Pregnancy | Current pregnancy in progress | Triangle symbol on family line | |
| Health Condition | Medical or mental health condition | Quadrant fill or pattern inside symbol |
This table shows the most commonly used genogram symbols. For complete details and visual examples, continue reading the guide below. Create your own genogram using WebGeno with all these symbols built-in.
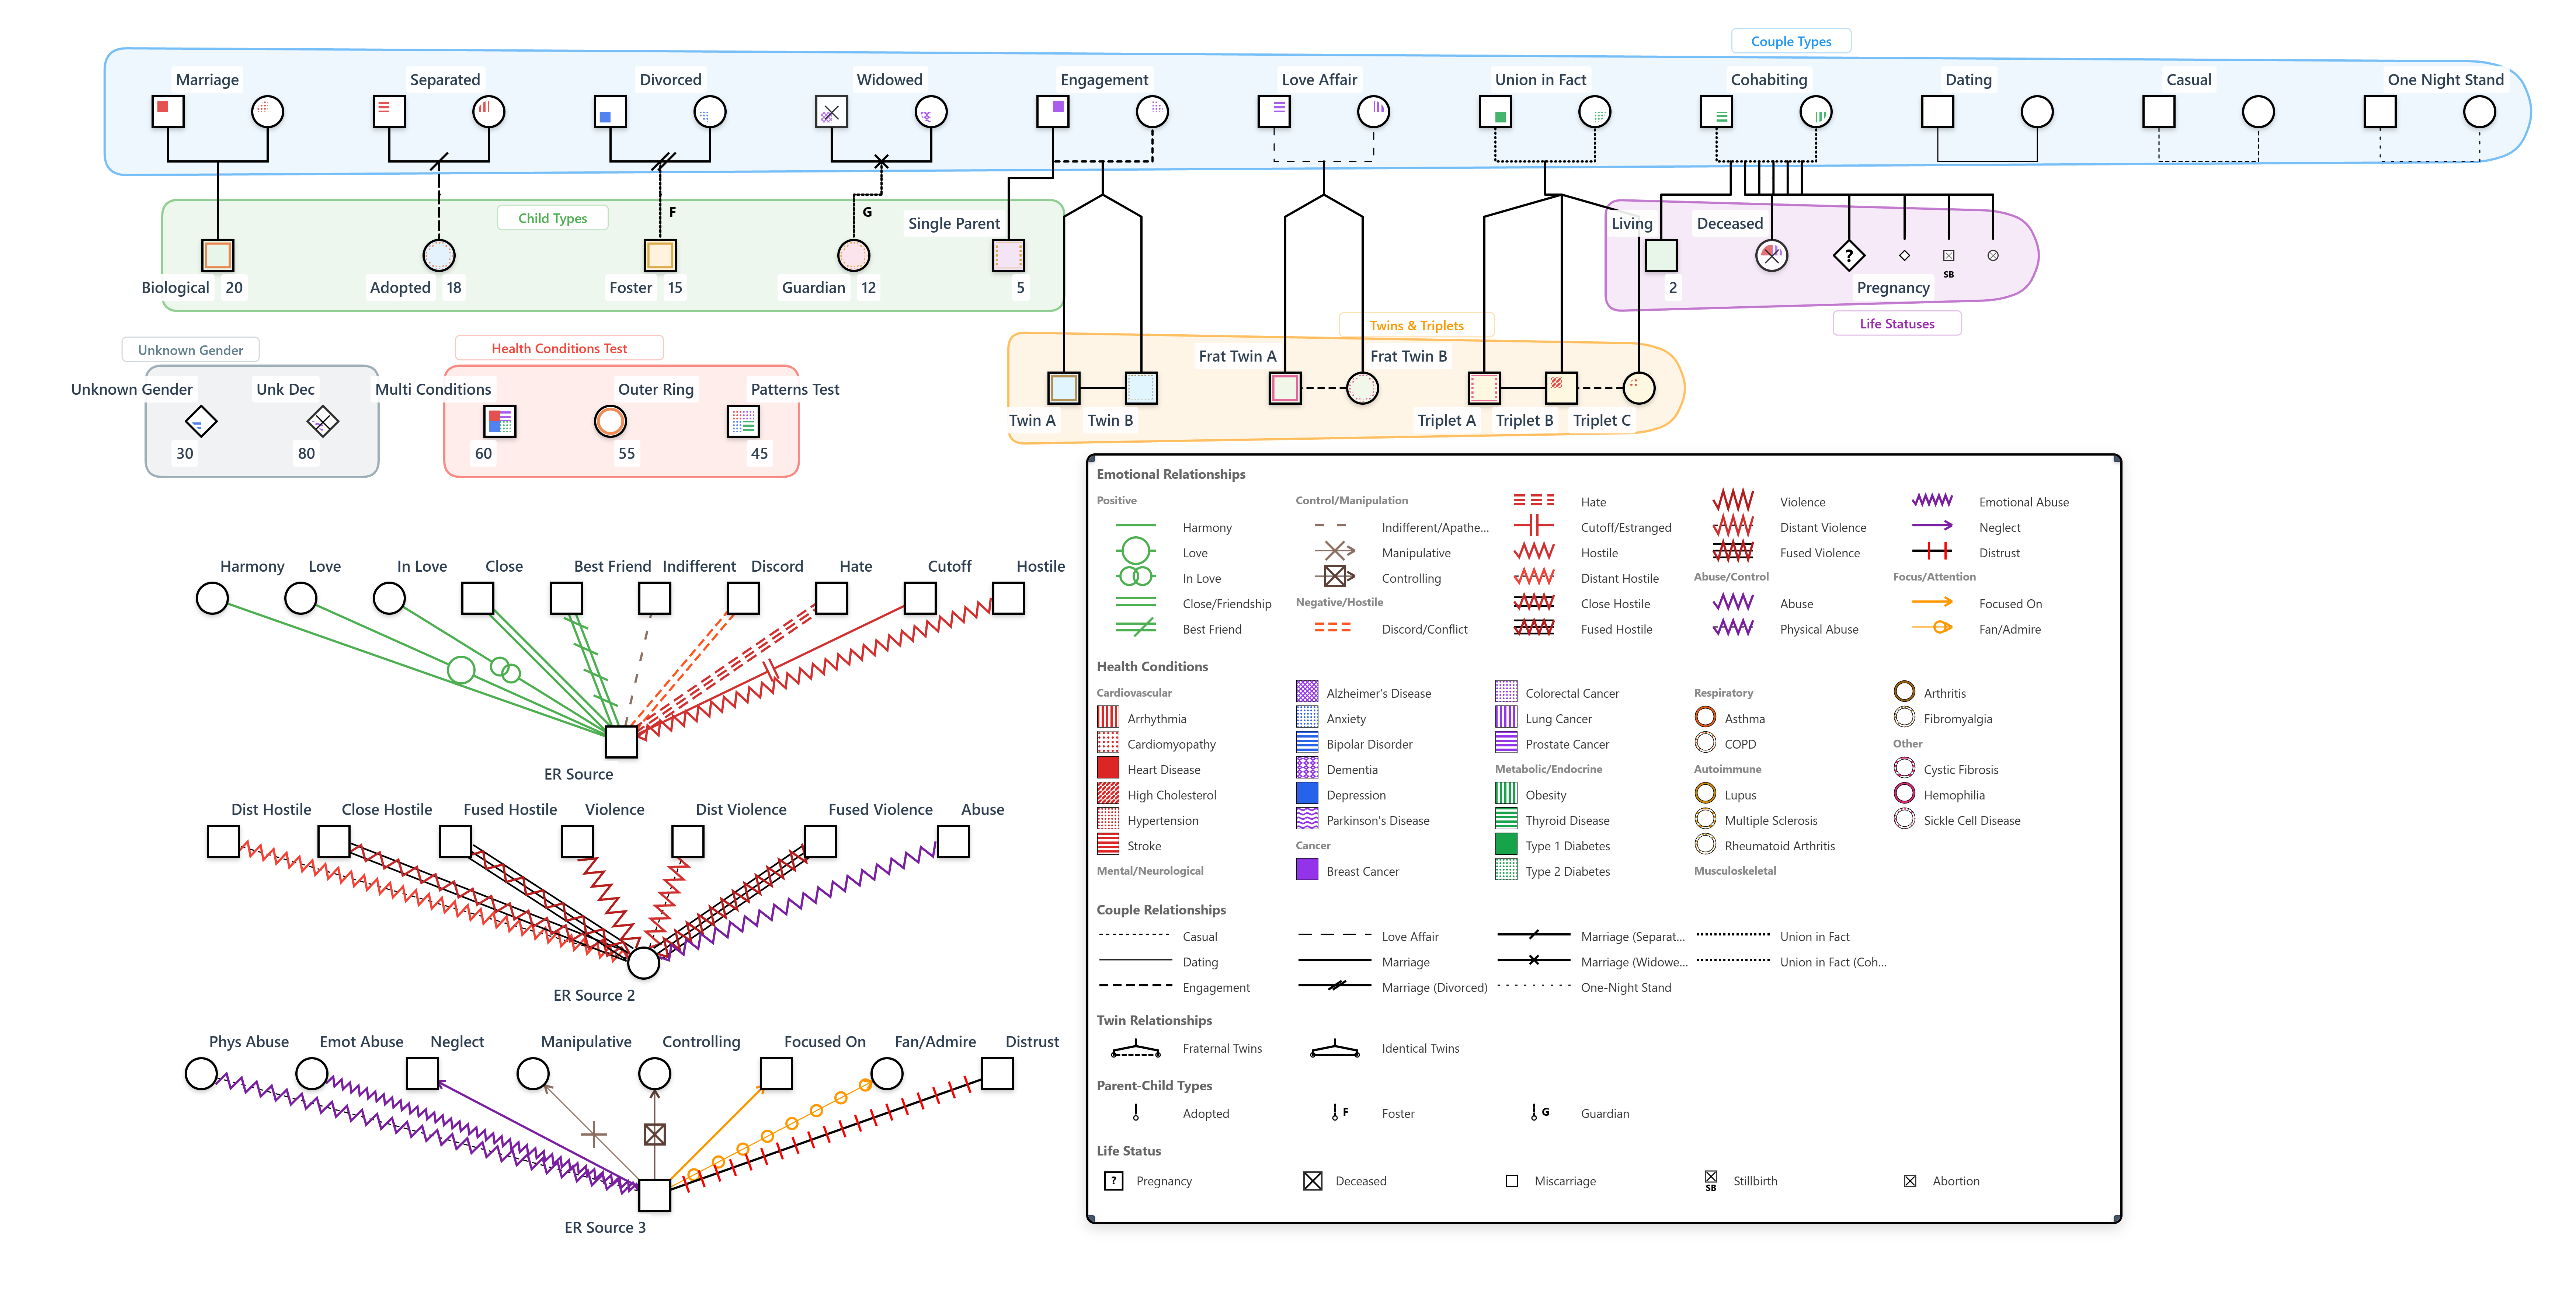
Murray Bowen developed the family diagram in the 1960s and 1970s as part of Bowen family systems theory. Monica McGoldrick and Randy Gerson later formalized the standardized genogram symbols that practitioners use today (McGoldrick & Gerson, 1985), a set further codified in subsequent editions (McGoldrick, Gerson & Petry, 2008, 2020). The symbols fall into three broad groups: structural symbols depicting family members, line symbols representing relationships, and shading or graphic symbols indicating health conditions and life circumstances.
Structural Symbols: Representing Family Members
The most fundamental genogram symbols represent individual family members. These symbols convey basic demographic information at a glance.
Gender Symbols
The core gender symbols have remained consistent since Bowen's original system:
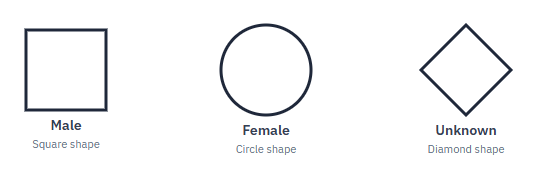
- Square: Male
- Circle: Female
- Question mark (?): Sex unknown or unspecified (placed in or beside the symbol)
- Diamond: Not a marker for unknown sex. In the most widely used conventions a diamond denotes a pet, while McGoldrick's 4th edition (2020) uses it for a non-binary or gender-diverse person. Always check the genogram's key.
Age and Status Indicators
Additional information can be incorporated into or around these basic shapes:
- Age: Written inside the symbol or below it
- Name: Written below or beside the symbol
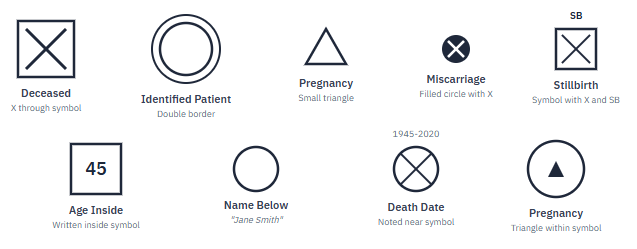
- Deceased: An "X" through the symbol, with death date noted
- Identified patient/client: Double border around the symbol
- Pregnancy: A triangle placed on the child line beneath the parents
- Miscarriage / spontaneous abortion: A small triangle with an "X" through it
- Induced (elective) abortion: As miscarriage, with an added horizontal line
- Stillbirth: The gender symbol (square or circle), drawn smaller, with an "X"; "SB" may be added as a label
Birth Order and Placement
According to standard conventions, children are arranged from left to right in order of birth, with the oldest on the left (McGoldrick, Gerson & Petry, 2008). Butler (2008) notes that in Bowen's original family diagram format, males were placed on the left and females on the right of couple pairings.
Pregnancy Loss Symbols: Miscarriage, Abortion, and Stillbirth
Pregnancy losses are recorded on the child line, in birth order alongside any other children of the couple. In the standard notation (McGoldrick, Gerson & Petry, 2020), each type of loss has its own symbol:
| Event | Symbol |
|---|---|
| Current pregnancy | A triangle on the child line |
| Miscarriage (spontaneous abortion) | A small triangle with an "X" through it |
| Induced (elective) abortion | A small triangle with an "X" plus a horizontal line |
| Stillbirth | The gender symbol (square or circle), drawn smaller, with an "X"; "SB" may be added as a label |
The gestational age or date is often noted beside the symbol when known. Recording pregnancy losses matters clinically: they are significant family events that can shape grief patterns, sibling relationships, and parental anxiety in later pregnancies, and their inclusion signals to clients that these losses count as part of the family story.
Relationship Lines: Mapping Family Connections
Relationship lines connect individual symbols to show how family members relate to one another. These lines represent both legal/biological relationships and emotional patterns.
Couple Relationships
Horizontal lines connect partners and indicate their relationship status:

- Marriage: Single solid horizontal line, usually with the marriage date (m. YYYY)
- Cohabitation/Living together: Dashed horizontal line (McGoldrick standard). Butler (2008) notes that Bowen's earlier family-diagram tradition instead used a solid line marked "LT"
- Engagement: Dashed or dotted line with notation
- Separation: Single line with one diagonal slash
- Divorce: Single line with two diagonal slashes
- Multiple marriages: Shown side by side, with the earliest marriage toward the outer edge and the current spouse placed closest to the index person
Parent-Child Connections
Vertical lines connect parents to children:
- Biological child: Solid vertical line from the couple line to the child
- Adopted child: Dashed vertical line (the standard); some practitioners add brackets or an "A"
- Foster child: Dotted vertical line, often with an "F" notation
- Twins: Two vertical lines converging to a single point on the couple line
- Identical twins: Twins connected by a horizontal bar
Emotional Relationship Patterns
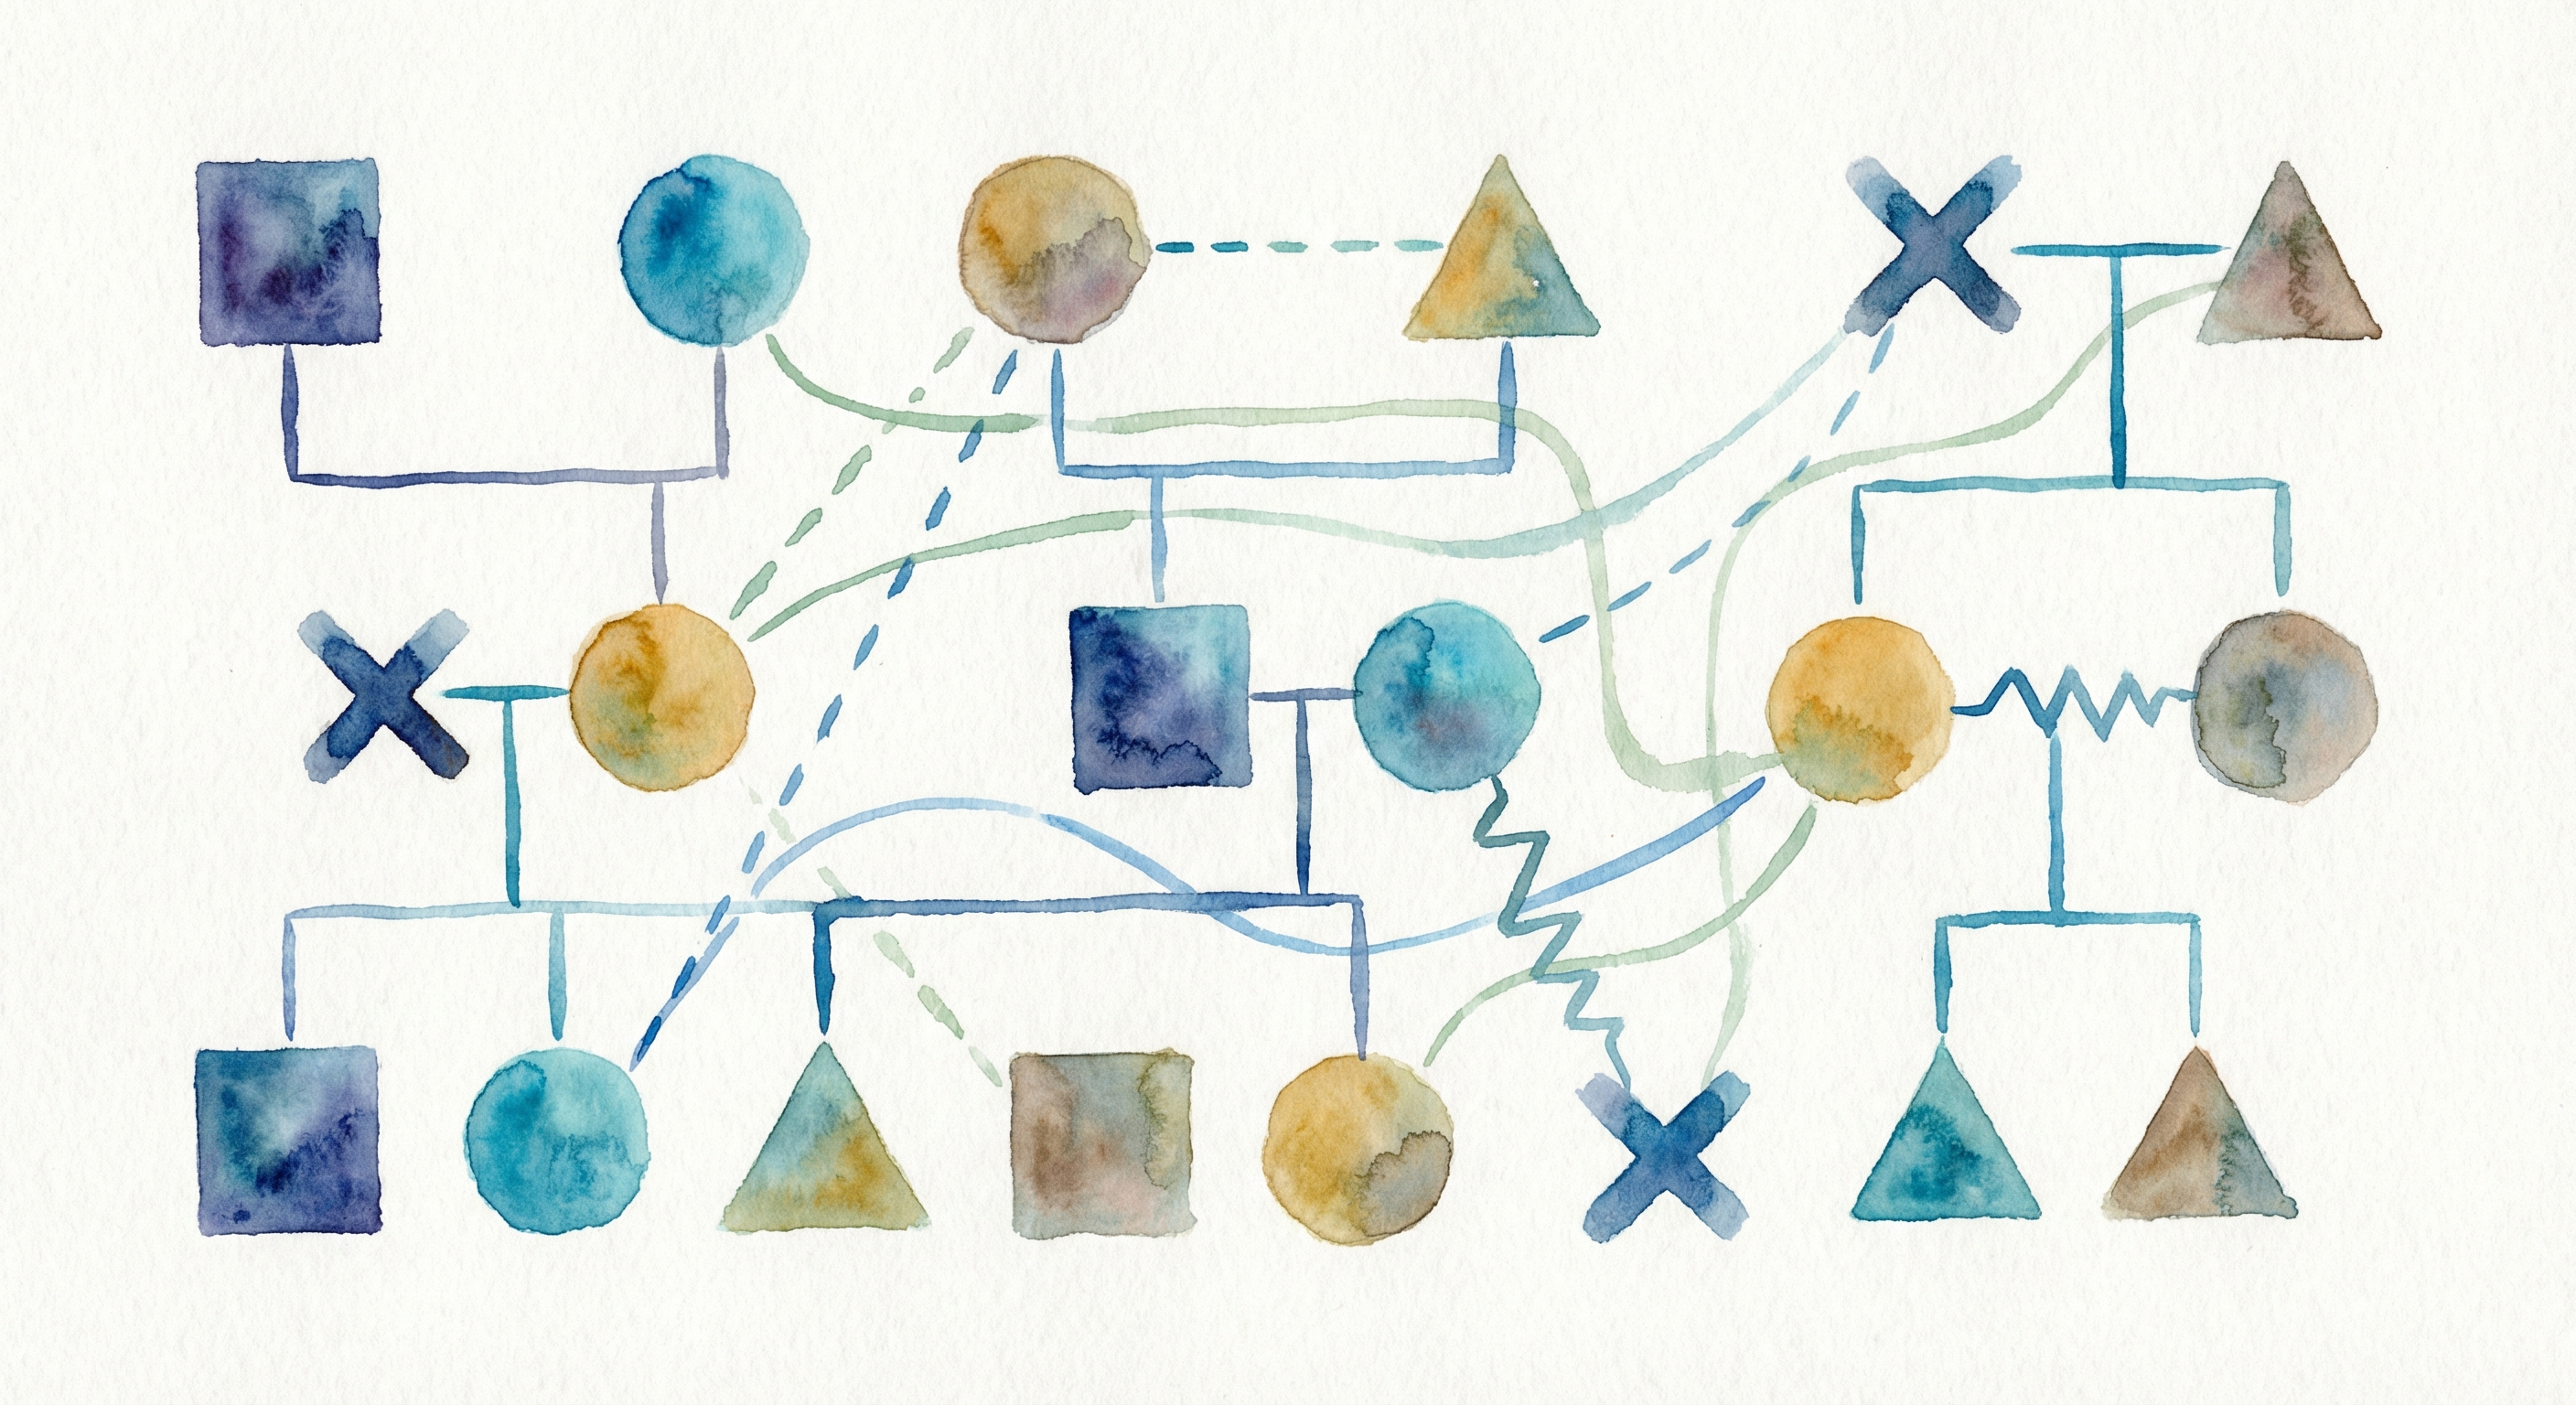
Beyond structural connections, genograms can depict the quality and nature of relationships between family members. McGoldrick and colleagues developed the extensive system of emotional-relationship lines that is widely treated as the standard reference for genogram practice. In the published standard these lines are monochrome and distinguished by pattern (not color); the color schemes seen in many software tools, WebGeno included, are added for on-screen readability.
Common Relationship Patterns
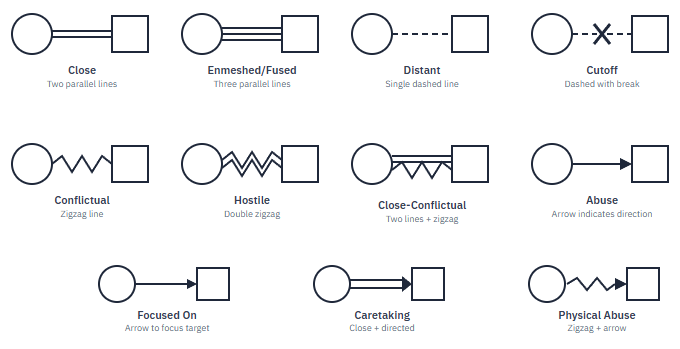
- Close: Two parallel lines
- Fused / Enmeshed: Three parallel lines — signifying a loss of boundaries, not simply healthy closeness
- Distant: Single dashed line
- Estranged / Cut off: Line with a break or perpendicular bars (a "fence")
- Conflictual: Jagged (zigzag) line. (A smooth wavy line is a separate symbol meaning a spiritual connection, not conflict.)
- Fused and conflictual: Three parallel lines overlaid with a jagged line
- Focused on: Arrow pointing toward the focus of attention
- Abusive: A jagged line ending in an arrow pointing at the abused person — a filled arrowhead denotes physical abuse, an open arrowhead emotional abuse, and a jagged line enclosed between two parallel lines sexual abuse
These relationship indicators help practitioners visualize emotional patterns that may span multiple generations, supporting assessment of what Bowen termed the "multigenerational transmission process" (Puskar & Nerone, 1996).
See these symbols in action.
WebGeno includes all standard relationship symbols — just click to add. Free, no sign up.
Try WebGeno Free →Health and Social Condition Symbols
One of the most clinically useful aspects of genograms is their capacity to track health conditions, mental health issues, and social circumstances across generations.
Standard Approaches from the Literature
The traditional method for representing health conditions involves shading or marking part of the individual's symbol, with a key explaining what each marking means:
- Lower-half shading: Substance or alcohol use — the most widely recognized condition convention
- Left-half (or other) shading: Physical or mental illness
- Fully shaded symbol: Indicates the person is affected by the charted condition
- Sectioned symbols: Some practitioners divide the symbol into sections, each keyed to a different condition or category
Health-condition notation is the least standardized part of genogram practice. Beyond the shading conventions above there is no single agreed icon for every disease, so practitioners and software tools adopt varying approaches and rely on a legend. (Note: shading a symbol to indicate carrier status belongs to medical-genetics pedigree charts, a related but distinct notation, not to standard genograms.)
Common Condition Categories
Regardless of the specific notation system used, practitioners commonly track:
- Cardiovascular conditions: Heart disease, hypertension, stroke
- Mental health: Depression, anxiety, bipolar disorder, schizophrenia
- Substance use: Alcohol abuse, drug addiction
- Cancer: Breast, colon, lung, and other malignancies
- Metabolic disorders: Diabetes, thyroid conditions
- Neurological conditions: Dementia, Parkinson's disease
64 health conditions, built right in.
WebGeno's pattern-based system makes tracking conditions across generations effortless.
Start Building →Specialized Symbol Systems
As genogram practice has evolved, practitioners have developed specialized symbol sets for specific clinical contexts.
Variations by Theoretical Approach
Butler (2008) documents numerous specialized genogram types, each with adapted symbols:
- Cultural Genogram (Hardy & Laszloffy, 1995): Incorporates cultural identity markers
- Spiritual Genogram (Wiggins-Frame, 2000): Religious affiliation and spiritual practices
- Sexual Genogram (Hof & Berman, 1986): Attitudes and patterns related to sexuality
- Time-line Genogram (Friedman et al., 1988): Temporal sequencing of events
Best Practices for Using Symbols
Consistency and Clarity
Whatever symbol system you use, consistency is essential. Because health-condition notation in particular is not fully standardized across the literature, clarity matters. To maintain it:
- Use a legend to define any symbols that might be ambiguous
- Follow established conventions (McGoldrick et al. remains the primary reference)
- Apply the same symbols consistently throughout a single genogram
Practical Considerations
- Keep it readable: Avoid overcrowding with too many symbols
- Use color strategically: Color can differentiate condition categories but ensure accessibility
- Date your genogram: Family situations change; dating helps track evolution
- Include a key: Especially important when sharing genograms across disciplines
How WebGeno Represents These Symbols
Everything above is the field standard. The notation in this section is specific to WebGeno and is offered as one practical, readable way to chart health conditions on screen; it is not a universal convention.
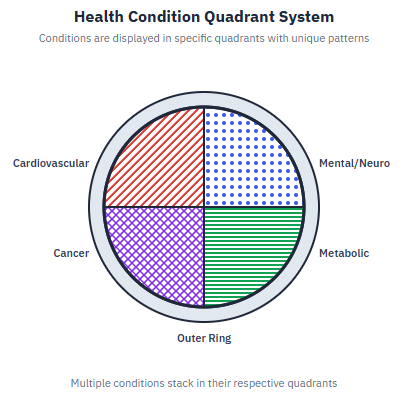
- Four inner quadrants: Cardiovascular (top-left), Mental/Neurological (top-right), Cancer (bottom-left), Metabolic/Endocrine (bottom-right)
- Outer ring: Additional categories including Respiratory, Autoimmune, Musculoskeletal, and Other conditions
- Distinct patterns: Each category uses a unique visual pattern (diagonal stripes, dots, crosshatch, horizontal lines, etc.) to aid quick identification
- Color: Added for on-screen readability; the published standard is monochrome and pattern-based
This WebGeno-specific implementation supports 64 pre-defined health conditions across 11 categories, with the ability to add custom conditions as needed. Because it builds on the standard idea of shading and sectioning a symbol, and always renders an explanatory legend, the genograms you create stay readable to practitioners who use the conventional notation.
See the quadrant system in action in this short demo:
Conclusion
Genogram symbols provide practitioners with a powerful visual vocabulary for documenting family patterns across generations. From basic structural symbols established by Bowen in the 1960s to contemporary additions for health conditions and relationship patterns, this system enables efficient communication of information that would otherwise require extensive narrative description.
Mastering these symbols allows practitioners to create genograms that serve multiple purposes: clinical assessment, treatment planning, client education, and professional communication. For practitioners new to genograms, beginning with the fundamental structural and relationship symbols provides a solid foundation. As familiarity grows, incorporating health condition tracking and specialized symbol systems can enhance the clinical utility of this essential assessment tool.
Ready to put these symbols into practice? Learn how to create a complete genogram from start to finish in our comprehensive step-by-step genogram tutorial, which walks you through the entire process of family assessment using these powerful visual tools.
Frequently Asked Questions About Genogram Symbols
What does a diamond mean in a genogram?
A diamond is not the standard symbol for unknown sex. Its meaning depends on the notation in use:
- Pet: In GenoPro and many agency manuals, a diamond marks a pet
- Non-binary / gender-diverse person: McGoldrick's 4th edition (2020) uses the diamond for this
To show that a person's sex is unknown, the standard marker is a question mark (?) placed in or beside the symbol, not a diamond. Always check the genogram's key.
What is the triangle symbol in a genogram?
The triangle is the pregnancy symbol, placed on the child line:
- Triangle: A current pregnancy
- Triangle with an 'X': Miscarriage (spontaneous abortion)
- Triangle with an 'X' plus a horizontal line: Induced (elective) abortion
The triangle is used only for pregnancies and pregnancy losses; it does not denote unknown sex (use a question mark for that).
What are genogram relationship symbols?
Genogram relationship symbols show the quality and type of connections between family members. In the published standard they are monochrome and distinguished by pattern:
- Single line (—): Marriage or formal relationship
- Double line (═): Close relationship
- Triple line (≡): Fused or enmeshed (a loss of boundaries, not simply closeness)
- Dashed line: Distant relationship
- Jagged / zigzag line: Conflictual relationship
- Broken line (— | —): Cutoff or estranged relationship
- One slash (/): Separation
- Two slashes (//): Divorce
These symbols help visualize family dynamics and emotional patterns across generations.
How do you show adoption in a genogram?
Adoption is shown with a dashed vertical line from the parents to the child:
- Dashed vertical line: The standard marker for an adopted child
- Brackets: Some practitioners add brackets around the child's symbol
- "A" notation: An "A" may be added near the connection line
Keep adoption distinct from foster care, which uses a dotted line: a dashed line is the adoption standard, a dotted line means foster.
How do you show twins in a genogram?
Twin relationships are shown with special connection patterns:
- Fraternal twins: Two separate vertical lines coming from the same point on the parents' marriage line
- Identical twins: Same as fraternal, but with a horizontal bar connecting the two children's symbols
- Birth order: Twins are typically placed side by side with the firstborn on the left
This notation makes it clear that the children were born at the same time while indicating whether they are identical or fraternal.
What do the different line types mean in genograms?
Line types in genograms communicate relationship quality and legal status:
- Thickness: Thicker lines often indicate closer or more significant relationships
- Solid lines: Strong, clear relationships (marriage, biological children)
- Dashed/dotted: Weaker, uncertain, or non-biological relationships
- Pattern variations: Different textures show different types of emotional connections
WebGeno automatically applies the correct line styles based on the relationship type you select.
How do you indicate health conditions in genograms?
Health conditions are shown by shading or marking part of the person's symbol, defined by a key:
- Lower-half shading: Substance or alcohol use (the most recognized convention)
- Left-half (or other) shading: Physical or mental illness
- Fully shaded symbol: The person is affected by the charted condition
- Sectioned symbols: Different areas keyed to different conditions
There is no single agreed icon for every disease, so always include a legend. WebGeno uses its own quadrant-and-pattern system (a software convention, not a field standard) and always renders the key.
What is the divorce symbol in a genogram?
Divorce is shown by two diagonal slashes through the horizontal line that connects a couple. A single diagonal slash means separation (the couple has split but is not divorced). The couple line itself stays solid; the slashes sit over it, and the divorce date is often written above the line.
What is the abortion symbol in a genogram?
A pregnancy is drawn on the child line as a triangle. A triangle with an X through it marks a miscarriage (spontaneous abortion). An induced or elective abortion is shown the same way with an added horizontal line. These markers sit on the child line beneath the parents, like any other child.
How is a deceased person shown in a genogram?
A deceased person is marked with an X drawn through their symbol (a square for a male, a circle for a female). The death date is usually noted near the symbol, often alongside the age at death. The symbol keeps its original shape so the person's place in the family stays clear.
How is birth order shown in a genogram?
Children are placed on the child line from left to right in order of birth, with the oldest on the left and the youngest on the right. Twins branch from a single point on the line; identical twins are additionally joined by a horizontal bar between their symbols.
Ready to create your own genogram with these symbols? Start free with WebGeno - all symbols are built-in and easy to use.
References
Butler, J. F. (2008). The family diagram and genogram: Comparisons and contrasts. The American Journal of Family Therapy, 36(3), 169–180. https://doi.org/10.1080/01926180701291055
Friedman, H., Rohrbaugh, M., & Krakauer, S. (1988). The time-line genogram: Highlighting temporal aspects of family relationships. Family Process, 27(3), 293–303.
Hardy, K. V., & Laszloffy, T. A. (1995). The cultural genogram: Key to training culturally competent family therapists. Journal of Marital and Family Therapy, 21(3), 227–237.
Hof, L., & Berman, E. (1986). The sexual genogram. Journal of Marital and Family Therapy, 12(1), 39–47.
McGoldrick, M., & Gerson, R. (1985). Genograms in family assessment. W. W. Norton.
McGoldrick, M., Gerson, R., & Petry, S. (2008). Genograms: Assessment and intervention (3rd ed.). W. W. Norton.
McGoldrick, M., Gerson, R., & Petry, S. (2020). Genograms: Assessment and treatment (4th ed.). W. W. Norton.
Multicultural Family Institute. (n.d.). Standard symbols for genograms. multiculturalfamily.org
Puskar, K., & Nerone, M. (1996). Genogram: A useful tool for nurse practitioners. Journal of Psychiatric and Mental Health Nursing, 3, 55–60.
Wiggins-Frame, M. (2000). The spiritual genogram in family therapy. Journal of Marital and Family Therapy, 26(2), 211–216.
Create Professional Genograms with WebGeno
WebGeno includes all standard genogram symbols with an intuitive interface. Build clear, professional family diagrams in minutes using our free genogram maker. Looking for clinical features for your practice? See our genogram software for therapists or for social workers. Migrating from GenoPro? Read our GenoPro alternative guide.
Try WebGeno Free